
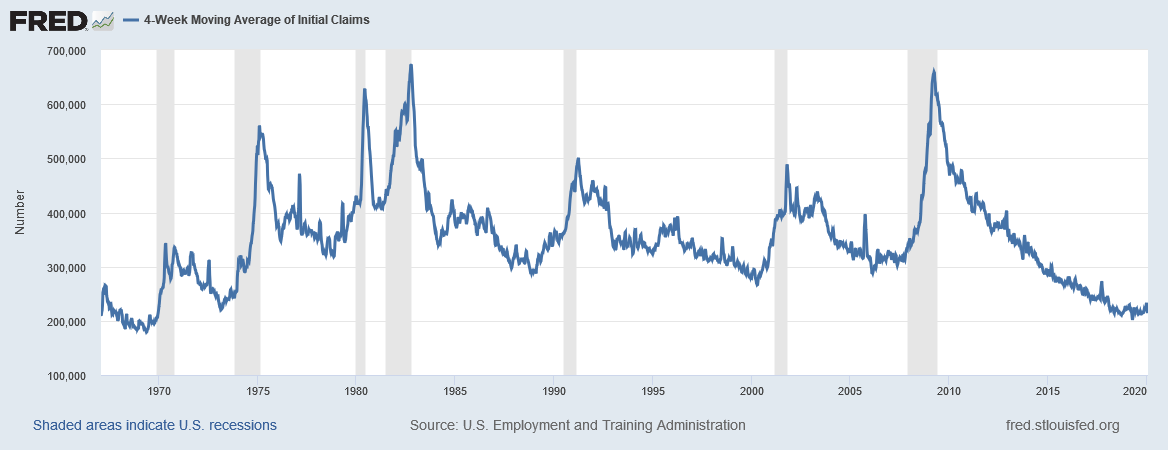
Chart of 4-Week Moving Average of Initial Jobless Claims from January 28, 1967 to January 25, 2020

Initial Jobless Claims measures the number of individuals who filed for unemployment insurance for the first time during the past week. Week to week initial jobless claims may be very volatile, so the four-week moving average attempts to smooth out the weekly data used for the initial jobless claims.
The largest increases in initial claims for the week ending January 18 were in: California 12,865, Puerto Rico 2,288, Illinois 2,104, Kansas 262, and Vermont 106, while the largest decreases were in Pennsylvania (10,138), Georgia (9,801), Texas (6,119), Missouri (5,975), and New York (5,491).