
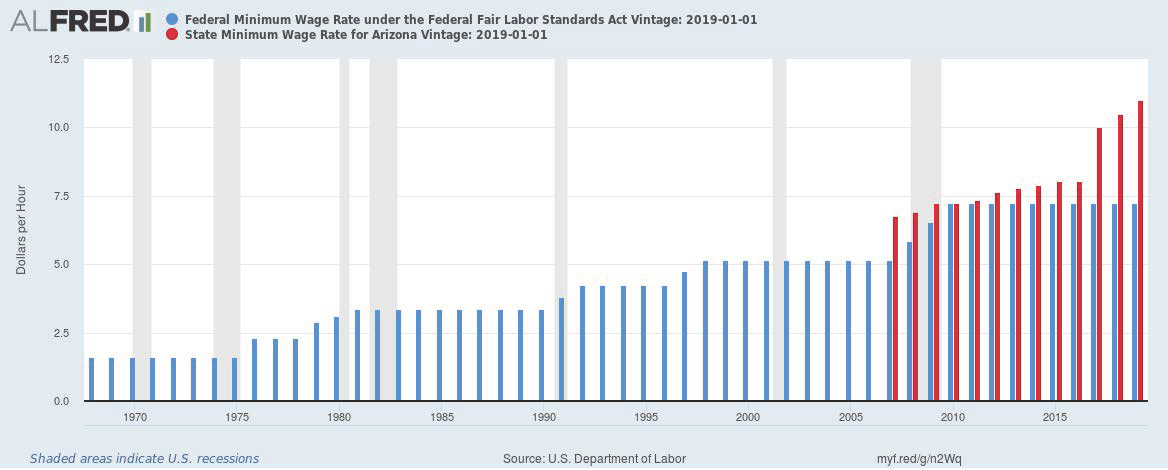
Chart of Federal Minimum Wage Rate Compared to the State Minimum Wage Rate

The first minimum wage rate was established in the United States with The Fair Labor Standards Act of 1938 and the initial minimum wage was $0.25 cents per hour. This chart shows Federal minimum wage from 1968, which was $1.60 per hour, to January 1, 2019 where the Federal minimum wage is now $7.25 per hour. (The blue bar on the chart.)
There are numerous states and cities that are setting their minimum wages higher than the Federal minimum wage. For comparison purposes, included in the graph is the State of Arizona minimum wage, starting in 2007 at $6.75 per hour (the red bar on the chart), when the Federal minimum wage was $5.15 per hour. The State of Arizona current minimum wage is $11.00 per hour.
As of 2018 there were 29 states and the District of Columbia with higher minimum wages than the Federal minimum wage: Alaska, Arizona, Arkansas, California, Colorado, Connecticut, Delaware, Florida, Hawaii, Illinois, Maine, Maryland, Massachusetts, Michigan, Minnesota, Missouri, Montana, Nebraska, Nevada, New Jersey, New Mexico, New York, Ohio, Oregon, Rhode Island, South Dakota, Vermont, Washington, West Virginia and the District of Columbia.
If you are interested in seeing a chart of your state’s minimum wage compared to the Federal minimum wage, please contact me.
Recent Comments