
Chart of Price per Gallon of Regular Gasoline and Breakdown of Costs Related to a Gallon of Regular Gasoline

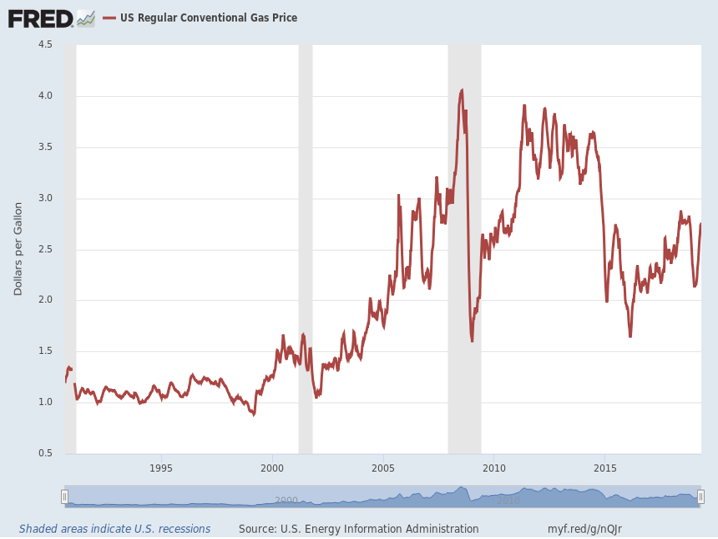
The following chart shows the national average cost of a gallon of gasoline since August 1990 to present. An interesting point related to the cost of a gallon of gasoline is that the price increases during the summer driving season and during recessionary periods (recessions are denoted by the shaded gray bars on the chart below).
Per U.S. Energy Information Administration, as of March 2019, the average nationwide cost of a gallon of regular gasoline was $2.52. The breakdown of the average nationwide cost of a gallon of regular gasoline is as follows: crude oil cost is 57% or $1.44, refining cost is 16% or 0.40¢, distribution and marketing costs are 8% or 0.20¢, and federal, state and local taxes costs are 19% or 0.48¢.
Though the cost of crude oil has the largest variable impact on the cost of a gallon of regular gasoline; federal, state and local taxes are the second largest cost of a gallon of regular gasoline. The state with the highest gasoline tax is Pennsylvania at 0.587¢ and the state with the lowest gasoline tax is Alaska at 0.1465¢. The current Federal gasoline tax is 0.184¢.
Per AAA, on May 6, 2019, the state with the highest cost of a gallon of regular gasoline was California at $4.099 and the state with the lowest cost of a gallon of regular gasoline was Alabama at $2.506.