
Chart of Household Debt Compared to Corporate Debt from January 1990 to January 2020

This chart shows household debt and corporate debt as a percentage of GDP.
Households take on debt for various reasons, such as, purchasing a house, buying a car and paying for education. Corporations take on debt for various reasons too, such as, capital improvement, stock buy backs and to build up seasonal inventory. Household debt in the U.S. increased from 59% of GDP in 1990 to 98% of GDP in 2009 and in 2019 household debt and corporate debt were the closest they have been in nearly 30 years.
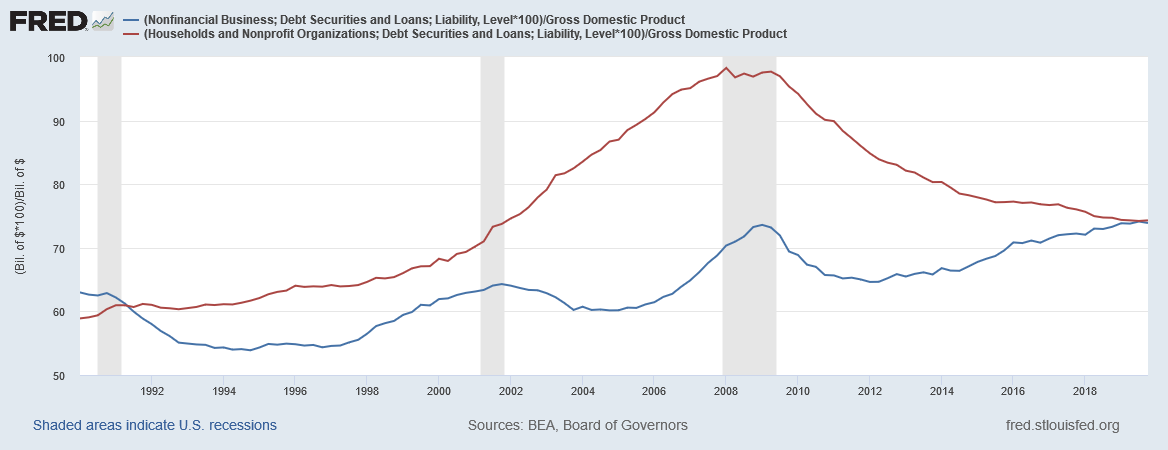
Household debt has exceeded corporate debt starting in the early 1990s and this gap was particularly large at the start of 2008 financial crisis. Since the 2008 financial crisis U.S. household debt has steadily declined as a percent of GDP, while corporate debt as a percent of GDP has increased since 2012. As of the last quarter of 2019, household debt and corporate debt were both around 74% of GDP.