
Chart of Average Weekly Hours Worked in UK from the Year 1260 to 2016

The chart below was constructed by the Bank of England as part of the Three Centuries of Macroeconomic Data project by combining data from a number of academic and official sources. Understanding hours worked helps determine the amount of time available for leisure and the measurement of productivity depends on the measurement of hours worked.
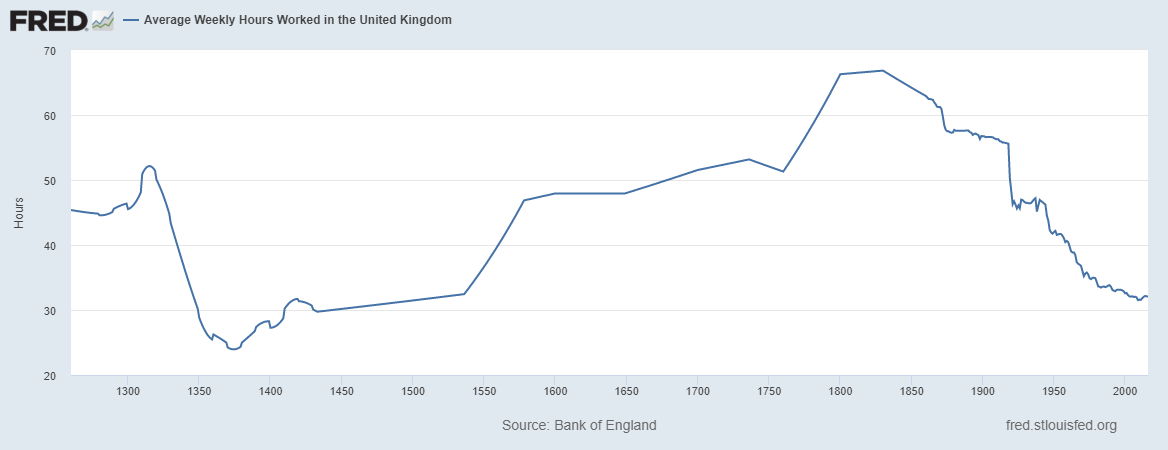
History buffs may be interested in look in to the fourteenth century, which was the time of the bubonic plague and the decline in average hours worked.
The Siburg Company specializes in buy-side and sell-side mergers and acquisitions, and strategic planning advisory services.
Contact us at (480) 502-2800