
Chart of Annual Unemployment Rate Since 1948

U.S. Bureau of Labor Statistics define unemployment as:
The unemployment rate represents the number of unemployed as a percentage of the labor force. Labor force data are restricted to people 16 years of age and older, who currently reside in 1 of the 50 states or the District of Columbia, who do not reside in institutions (e.g., penal and mental facilities, homes for the aged), and who are not on active duty in the Armed Forces.
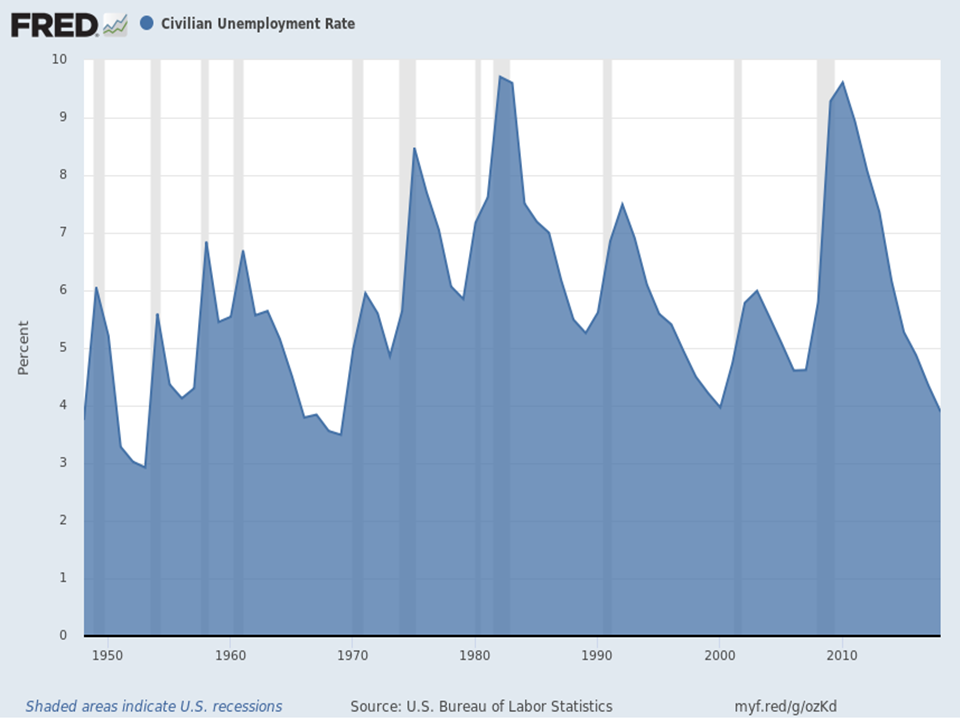
As of January 1, 1948, the unemployment rate was 3.8%, as of January 1, 2019, the unemployment rate was 3.9% and as of July 2019 the unemployment rate was 3.7%.