
Chart of Total Assets Held by Classes of Households for July 1989 to April 2019

Total assets held include real estate, financial assets, such as stocks and bonds and consumer durable goods, which are goods that wear out over a long period such as, cars and home appliances.
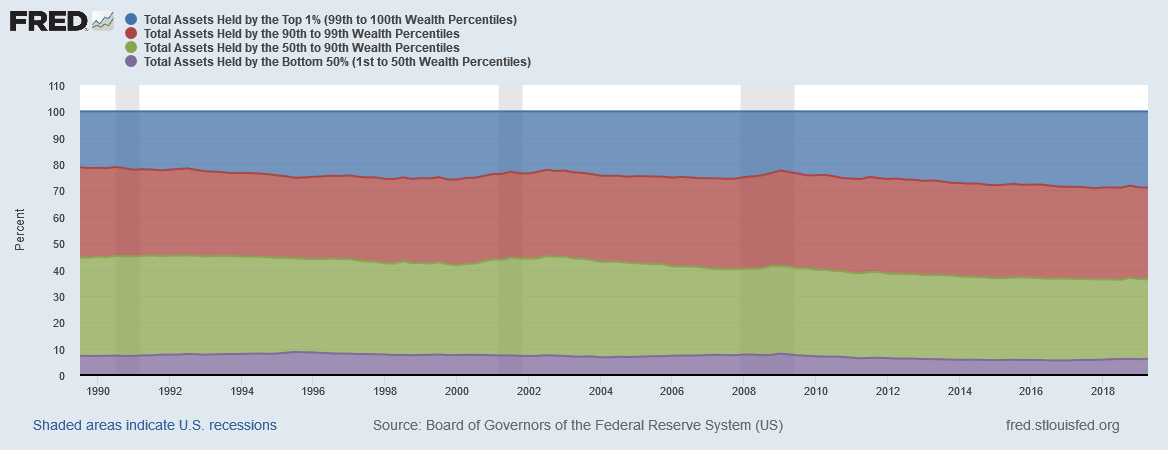
In July 1989 the top 1% held 21.3%, the 90th to 99th wealthiest percentile was 34.2%, the 50th to 90th wealthiest percentile was 37.2% and bottom 50% was 7.3% of the total assets held. As of April 2019, the top 1% held 29.0%, the 90th to 99th wealthiest percentile was 34.7%, the 50th to 90th wealthiest percentile was 30.2% and the bottom 50% was 6.1% for the total assets held.