
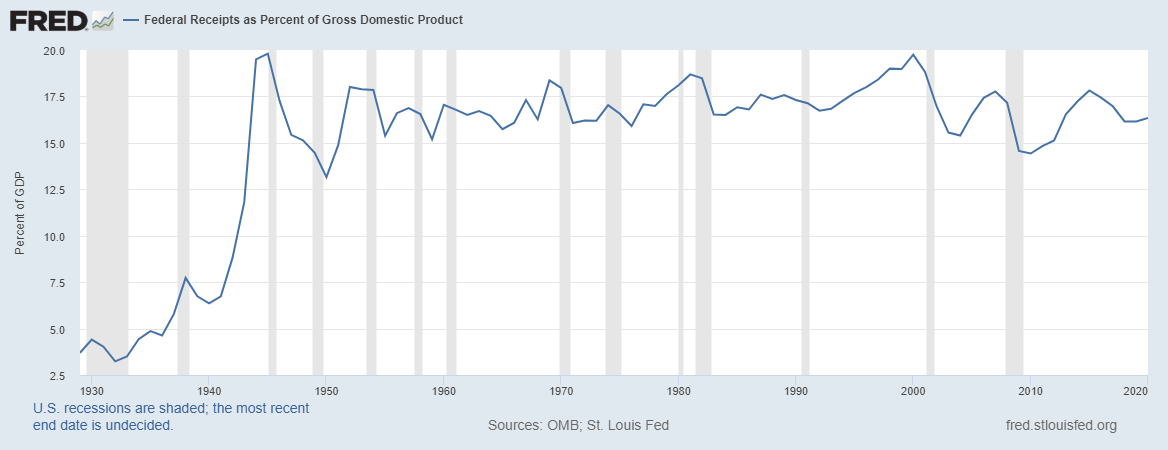
Chart of Federal Tax Receipts as a Percent of GDP from 1929 to 2020

Tax season may have you questioning if the Federal tax burden increasing or decreasing. The chart shows aggregate U.S. Federal tax receipts as a percentage of Gross Domestic Product (GDP). Apart from the large increase during World War II, otherwise there is no real trend.
The US uses a progressive income tax rate: As a taxpayer’s income grows, a taxpayer has to pay a larger share of their income to taxes. In 1969 the Alternative Minimum Tax (AMT) was introduced and only applied to 155 taxpayers. Today, the AMT applies to several million taxpayers.