
Chart of the Price Change Between Years for Hotels and Casino Hotels During August 2015 to August 2020

The chart shows producer price index (PPI) data that measure price changes. Percent changes in prices from a year ago are shown for both stand-alone hotels (the gold bar) and hotels attached to casinos (the red bar).
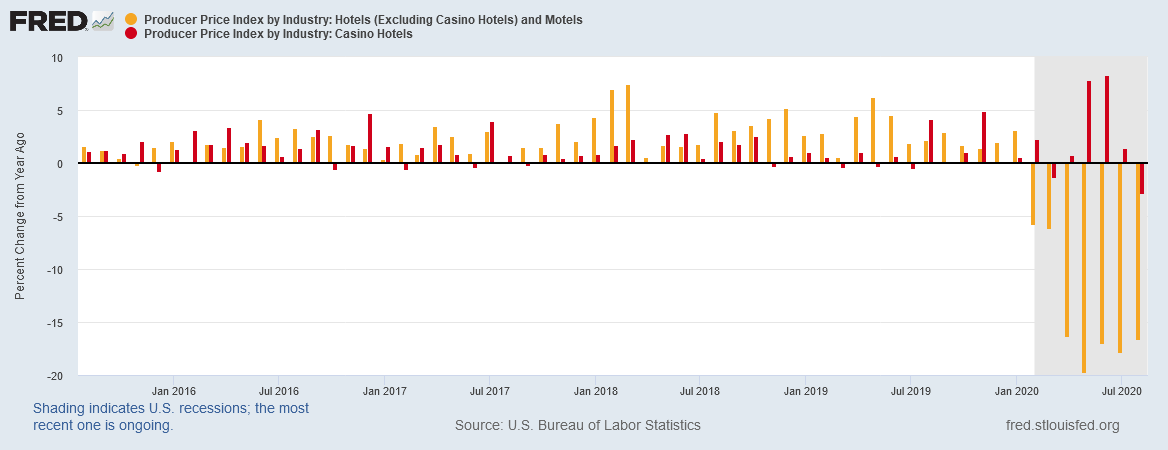
Prices began dropping for hotels in February 2020 and the price reductions continue to persist, but hotels attached to casinos show an increase for most of the periods. The pricing variations may reflect the difference between consumer demand for these two different types of hotels.