
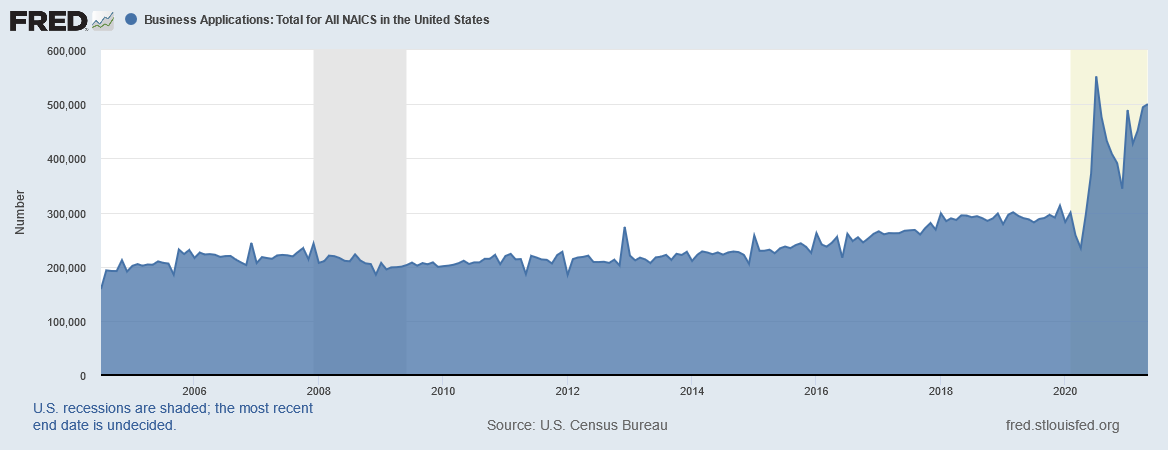
Chart of Total Business Applications in the United States from July 2004 to May 2021

The chart below shows the core business applications series that correspond to a subset of all applications for an Employer Identification Number (EIN). The chart below shows that the US economy is creating new businesses at a strong pace.
The business formation statistics only cover applications for an EIN. Therefore, certain businesses initiated without an EIN, such as, businesses formed that use the business owner’s social security number for tax purposes may not be covered by these business formation statistics.
The Siburg Company specializes in buy-side and sell-side mergers and acquisitions, and strategic planning consulting services.
Contact us at (480) 502-2800