
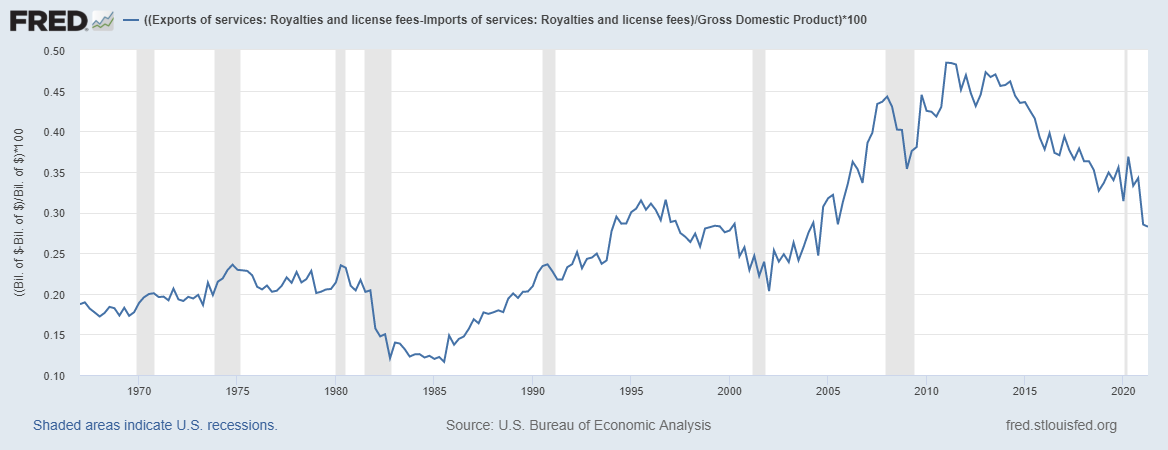
Graph of U.S. Net Exports of Technology from January 1967 to March 2021

Net exports of technology are measured as royalties and license fees received minus royalties and license fees paid as a percentage of GDP.
Net exports of technology are measured as royalties and license fees received minus royalties and license fees paid as a percentage of GDP.
The Siburg Company specializes in buy-side and sell-side mergers and acquisitions, and strategic planning consulting services.
Contact us at (480) 502-2800