
Chart of United State Homeownership Q1 1965 to Q1 2022

The FRED chart below is a view into homeownership rate over five plus decades in the United State. Homeownership is part of the American Dream and a large part of the American economy. Given the recent rise in house prices, the social economic question is whether the rise in home prices is because ownership is higher or that ownership is lower because houses have become less affordable or is it a simple lack of new homes being built.
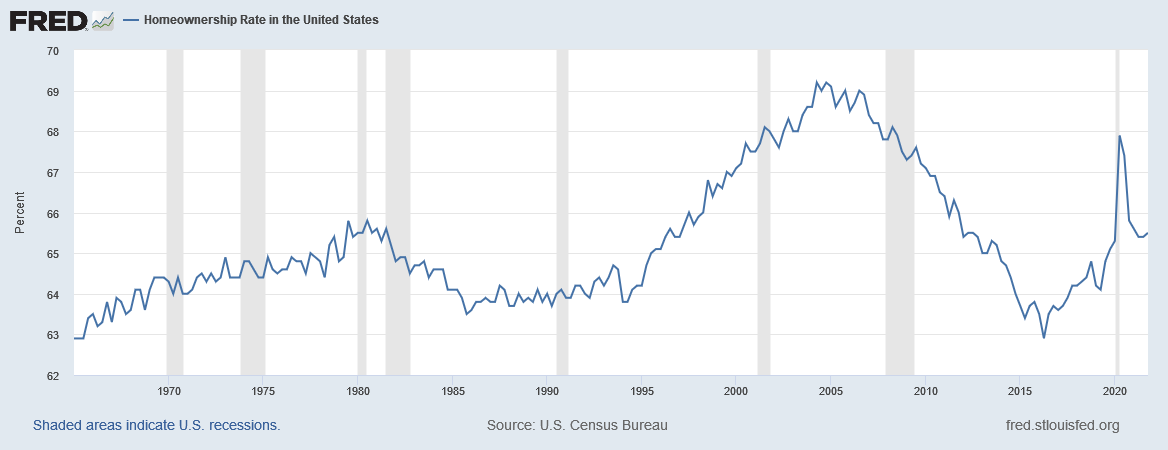
It is unclear what the recent large variation in homeownership rate means. The homeownership rate spiked in 2020 during the early phase of the pandemic, which looks like an acceleration of a trend starting 2016. But since the homeownership peak in 2020, the homeownership rate has dropped back down to pre-pandemic rates and seems to have leveled out. These changes are complex issues related to housing demand and affordability, which will be affected by future economic conditions.
The Siburg Company specializes in buy-side and sell-side mergers and acquisitions, and strategic planning consulting services.
Contact us at (480) 502-2800