
Chart of Net Change of Net Worth by Age Group From Under Age 25 to Age 65 and Over

This chart shows household wealth increases and decreases when the values of financial assets and housing assets go up and down. Increases and decreases in net worth, which is the difference between the value of your assets and the value of your liabilities and the impact age has on the net worth of households. This includes Baby Boomers, Generation Xers, and Millennials, and the two youngest generations Generation Z and Aers accumulated wealth.
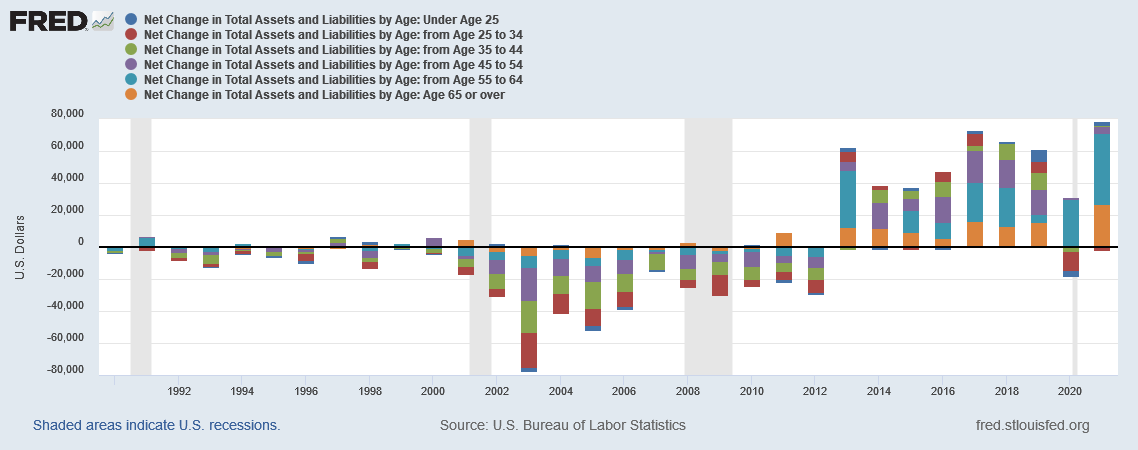
This chart shows household wealth increases and decreases when the values of financial assets and housing assets go up and down. Increases and decreases in net worth, which is the difference between the value of your assets and the value of your liabilities and the impact age has on the net worth of households. This includes Baby Boomers, Generation Xers, and Millennials, and the two youngest generations Generation Z and Aers accumulated wealth.
Please contact The Siburg Company anytime to discuss your business’s strategic plans.
The Siburg Company specializes in sell-side and buy-side mergers and acquisitions, and M&A advisory services.
Contact us at (480) 502-2800