
Graph of CPI and PPI from December 1950 to March 2021

As of March 2021, both the CPI (Consumer Price Index) and PPI (Producer Price Index) have shown increases. The CPIs are based on prices for food, clothing, shelter, and fuels; transportation fares; service fees, such as water and sewer service, and sales taxes. The producer price index (PPI) measures the price that industrial producers get for their goods.
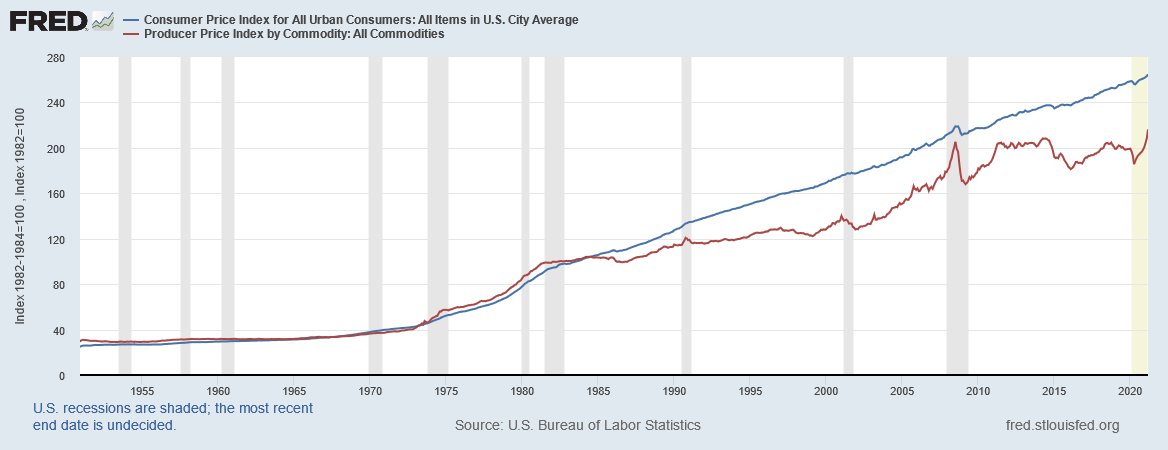
CPI measures changes in costs from the consumer’s point of view, while PPI measures industrial price changes from the sellers (industries) viewpoint. Permanent increases in PPI costs, in time are passed through to the CPI.